
Most pressure washing statistics you find online are the same dozen numbers copied between blogs, usually with no source and often measuring something other than what the headline claims. We went looking for the primary sources. Some of them do not exist.
This page separates three things that normally get mixed together: what the US government actually counts, what industry research firms report, and what we model ourselves. Every figure says which of the three it is, and the pressure washing statistics we could not stand behind are listed at the end with an explanation of why each one failed.
Everything here is free to cite. There is a citation block near the bottom with the wording written for you.
Last reviewed: September 2026.
There is no government category for this trade
Start here, because it explains most of the confusion in every other set of pressure washing statistics you will read.
The US Census Bureau classifies businesses by NAICS code. Pressure washing does not have one. It sits inside 561790, “Other Services to Buildings and Dwellings,” which is a residual bucket, and it shares that bucket with work that has nothing to do with it.
| Also classified as 561790 | Classified elsewhere |
|---|---|
| Swimming pool cleaning and maintenance | Janitorial services (561720) |
| Chimney cleaning | Landscaping services (561730) |
| Ventilation and duct cleaning | Carpet and upholstery cleaning (561740) |
| Drain and gutter cleaning | Pest control (561710) |
| Snow plowing sold as a standalone service | Window cleaning |
| Lighting maintenance, bulb and fuse replacement | Sandblasting of building exteriors |
So any establishment count for 561790 overstates pressure washing, because it is counting pool cleaners and chimney sweeps too.
At the same time the revenue figures understate the trade, for two reasons that have nothing to do with the code being broad. Most operators are sole proprietors with no payroll, which puts them outside employer-based statistics altogether. And a large share of exterior cleaning is billed by landscapers, roofers and painters who are coded to their own primary industry.
Both distortions are real and they push in opposite directions. Anyone who tells you the exact size of this industry is guessing.
That is the first thing to know about any pressure washing statistics you are about to read, including ours.
Which pressure washing statistics the government actually collects
These are the hardest pressure washing statistics available, because they come straight from the Bureau of Labor Statistics. None of them measures pressure washing specifically, and we are not going to pretend otherwise. They are the nearest official benchmarks.
| Measure | Figure | Source and year |
|---|---|---|
| Building Cleaning Workers, All Other (37-2019) — employment | 13,740 | BLS OEWS, May 2023 |
| Building Cleaning Workers, All Other — mean hourly wage | $21.03 | BLS OEWS, May 2023 |
| Building Cleaning Workers, All Other — 90th percentile | $29.25/hr | BLS OEWS, May 2023 |
| Janitors and Cleaners (37-2011) — mean hourly wage | $17.43 | BLS OEWS, May 2023 |
| Services to Buildings and Dwellings (NAICS 5617) — employment | 2,245,890 | BLS OEWS, May 2023 |
| Janitors and building cleaners — projected growth | +2% to 2035 | BLS Occupational Outlook Handbook, 2025 |
| SBA small-business threshold for NAICS 561790 | $9.0m average annual receipts | SBA Table of Size Standards, 2023 |
The closest proxy is Building Cleaning Workers, All Other, occupation code 37-2019. It is the residual category for building cleaners who are not janitors, maids or window washers, and its mean wage of $21.03 an hour sits well above the $17.43 for janitors. That gap is consistent with a trade that runs equipment and carries liability.
Treat it as a floor rather than a rate. It is what employees earn, not what contractors bill.
Why these pressure washing statistics undercount the trade
Every table above is built from payroll. A one-man operation with a truck, a trailer and no employees never appears in it, and that describes most of this industry. The official numbers are accurate about the part of the trade that files payroll returns and silent about the rest.
What the industry reports say
Three figures circulate constantly. All of them trace back to a single paid IBISWorld report, and we have not been able to open that report ourselves.
| Figure | Value | How we got it |
|---|---|---|
| Industry revenue | $1.2 billion | IBISWorld, reported secondhand. We have not seen the primary report |
| Number of businesses | 32,193 | IBISWorld, reported secondhand |
| Employment | 41,799 | IBISWorld, reported secondhand |
| Businesses including secondary providers | 68,000 – 75,000 | A supplier’s own triangulation. Not a source. Listed to show how wide the definitional gap is |
We are publishing them with that caveat attached rather than quietly presenting them as fact, which is what every other page carrying these pressure washing statistics does.
One number is worth pausing on. Roughly 32,000 businesses employing about 42,000 people works out at barely more than one employee per company. Whatever the precision of those figures, the shape they describe is right: this is a trade of solo operators and two-person crews.
It is the one piece of these pressure washing statistics we would defend even if the underlying numbers moved.
What homeowners pay
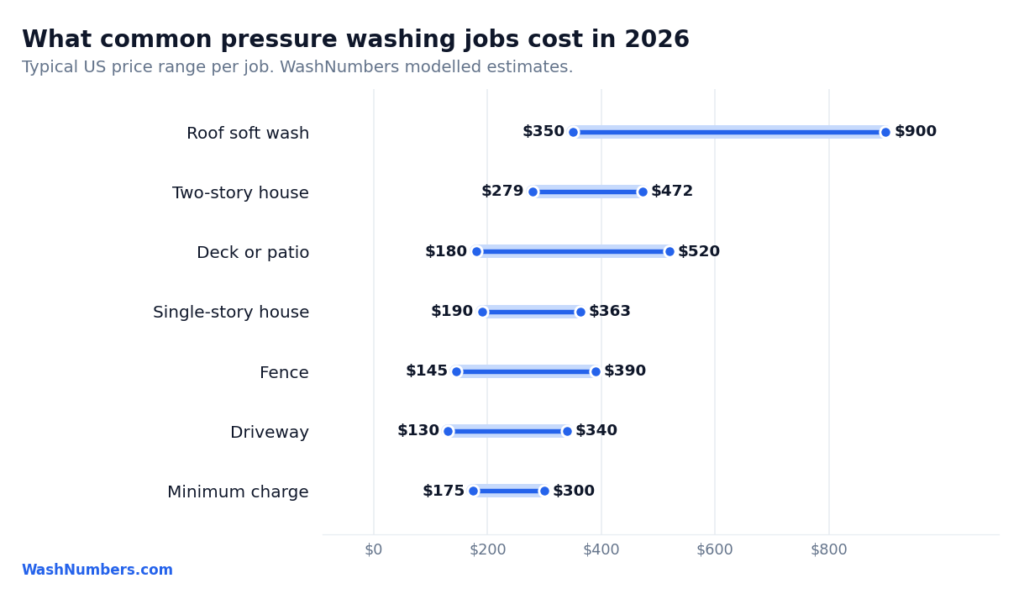
These are WashNumbers figures, and they are the only pressure washing statistics on this page that we produce ourselves. They are modelled from published rates and our own cost work, not measured, and the methodology behind them is public.
| Job | Typical range | Source | Note |
|---|---|---|---|
| House wash, single storey | $218 – $363 | WashNumbers model | Soft wash, not pressure |
| House wash, two storey | $279 – $472 | WashNumbers model | Access is most of the difference |
| Model rate per square foot, by surface | $0.40 – $0.49 | WashNumbers model | Patio at the low end, deck at the high end. Open concrete sits at $0.46 |
| Minimum service charge | $175 – $300 | Observed | Roughly two hours of the contractor’s rate |
The minimum service charge surprises people more than any other line. At modelled rates of $0.40 to $0.49 per square foot against a $175 to $300 minimum, the minimum controls the price on jobs of roughly 357 to 750 square feet and below, before condition and access adjustments. That is why a small job and a slightly bigger one often land at the same number.
What contractors charge and what it costs them
| Measure | Figure | Basis |
|---|---|---|
| Published hourly rates | $50 – $150 | Industry sources, wide enough to be close to useless |
| Annual overhead, solo operator | ≈ $14,200 | WashNumbers model |
| Billable hours per year | 900 – 1,200 | WashNumbers model |
| Overhead per billable hour | $14.20 | WashNumbers model, at 1,000 hours |
| Break-even rate, $60,000 owner pay and $14,200 costs over 1,000 billable hours | $74.20 per hour | WashNumbers model |
| Target rate for the same operator at a 20% profit margin | $92.75 per hour | WashNumbers model |
The gap between the published hourly range and the break-even calculation is the most useful thing on this page. A contractor quoting at the bottom of the $50 to $150 range is, in a lot of cases, working below what their own overhead requires once non-billable hours are counted honestly.
The billable hour problem
A full-time year is 2,080 hours. A solo operator bills between 900 and 1,200 of them. Driving, quoting, invoicing, loading, buying chemical and weather absorb the rest.
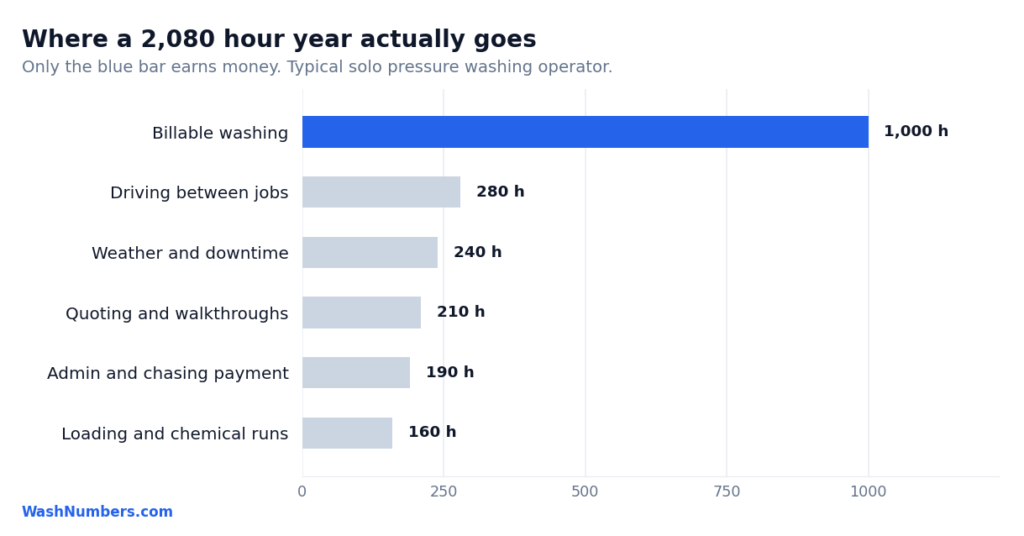
That single fact roughly doubles the real overhead cost per billable hour compared with the figure most operators calculate. Our guide on how much to charge for pressure washing works through it properly.
Wash water and the Clean Water Act
Storm drains discharge to rivers and lakes without treatment. Wash water carrying detergent, grease, oil or heavy metals is a pollutant, and directing it into a storm drain is a violation that can land on the property owner as well as the contractor. The EPA’s Clean Water Act compliance programme covers enforcement, and most municipalities add a stormwater ordinance on top.
This is the largest unexplained variable in commercial quotes. Two bids on the same property can differ by a factor of three, and the wash water plan usually accounts for most of the gap. Our commercial pressure washing cost guide shows how it changes a quote in practice.
Pressure washing statistics we will not publish
This section is the reason the page exists. Each of these appears in most published collections of pressure washing statistics and each one fails on inspection.
- “The US pressure washing market is $390 million.” That is the market for pressure washer machines, not for the services. It gets listed alongside service-industry revenue, inviting readers to conflate a hardware market with a services market roughly three times its size. Most “market size” reports in search results have the same problem.
- “68% of US households used pressure washing services in the past five years.” Traces to a statistics aggregator that promises a primary source for every figure and then supplies none, for any of its 146 claims.
- “35 to 42% of new pressure washing businesses fail in year one, per SBA data for NAICS 561790.” The SBA does not publish first-year failure rates at six-digit NAICS level. The citation names a source that does not contain the statistic.
- Any seasonal demand figure. We could not find a single citable source for the spring and summer peak everyone in this trade knows is real. The serious seasonal search studies cover HVAC, plumbing, electrical and roofing, and leave exterior cleaning out. Rather than borrow a number from a contractor’s marketing blog, we are leaving this blank until we can generate it properly and publish the method.
What we do not know yet
Being straight about the gaps is part of the point.
There is no reliable public data on what contractors actually charge, state by state. Every published figure, including several of ours, ultimately traces to lead-generation platforms that collect prices after a job rather than from the people writing quotes.
We are fixing that. A contractor pricing survey is collecting rates directly from working US contractors right now: minimum charges, per-square-foot rates by surface, and the upcharges nobody publishes. When it closes, the modelled figures on this page get replaced with survey data and the source column will say so.
Until then, treat the pressure washing statistics on this page as the best available rather than the last word.
The other gap we would like closed is the ratio of employer to non-employer establishments in NAICS 561790. That single number is the hard evidence for how badly official statistics undercount this trade, and it is sitting in Census data waiting for somebody to pull it.
If you price this work for a living, the survey takes three minutes and contributors see the results before they go public.
How to cite this page
You may quote these figures for editorial or educational use. When referencing this research online, please credit WashNumbers and link to this page where editorially appropriate.
We would rather these pressure washing statistics travelled with a link than got copied without one.
Source: WashNumbers, “Pressure Washing Statistics,” https://washnumbers.com/pressure-washing-statistics/ (September 2026). Figures marked as models are WashNumbers estimates; federal figures are from the Bureau of Labor Statistics.
The charts can be reproduced as they are. If you need a figure broken down differently, or a chart for a specific state or surface, get in touch and we will put it together.
Sources for these pressure washing statistics
| Source | What it covers | Year |
|---|---|---|
| BLS OEWS — Building Cleaning Workers, All Other (37-2019) | Employment and wages for the nearest occupation to this trade | May 2023 |
| BLS OEWS — Janitors and Cleaners (37-2011) | The wage benchmark we compare against | May 2023 |
| BLS OEWS — Services to Buildings and Dwellings (NAICS 5617) | Total industry employment | May 2023 |
| BLS Occupational Outlook Handbook | Median pay and projected growth | 2025 |
| US Census Bureau, NAICS | Definition and contents of code 561790 | 2022 revision |
| SBA Table of Size Standards | Small-business receipts threshold for 561790 | 2023 |
| US EPA, Clean Water Act compliance monitoring | Wash water discharge and enforcement | Current |
| IBISWorld, Pressure Washing Services in the US | Revenue, business and employment counts. Secondhand only, no link because we have not seen the report | 2024 |
| WashNumbers cost models | All pricing figures marked as models | 2026 |
Figures marked as WashNumbers models are our own estimates built from published rates and cost modelling. They are planning figures, not measured averages, and the full methodology explains how each one is derived and what it cannot account for. Our calculators use the same numbers.
Where these numbers come from
2026 Pricing Dataset
220 observations, 28 sources, open in your browser.
Methodology
What we include, what we exclude, and why.
Industry Statistics
Market size, operator counts and what the trade actually looks like.
The Contractor Survey
The next edition is built from rates given directly by operators.
 Written by Diego Hernández, founder of WashNumbers. Cost models are built from published contractor rates and public price observations. See how we build these numbers.
Last reviewed: September 2026